


Week 2
Based on the following table, I was able to obtain certain results while experimenting with red cabbage leaves.
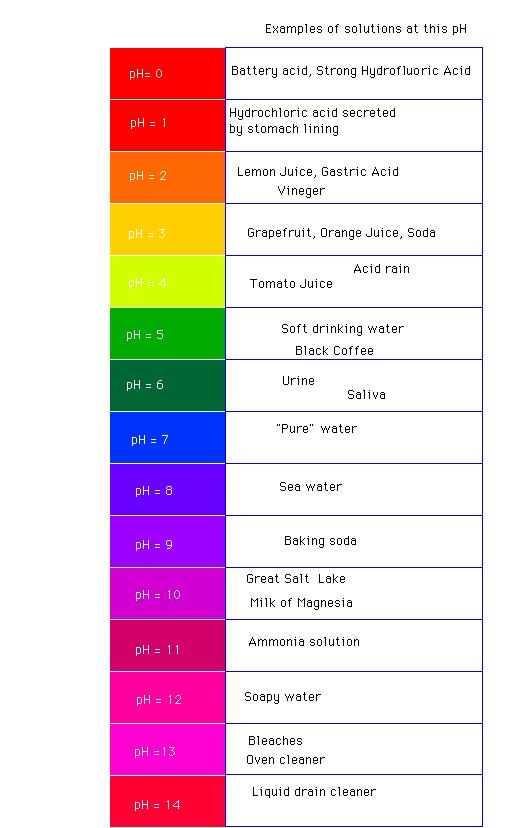
GRAPH OF UNIVERSAL pH(independent variable)
TASK COMPLETED:
SOAKING
Different samples of red cabbage leaves were soaked in solutions of different pH for about 20 minutes and the corresponding color change was noted and tabulated as follows.
pH OF RED CABBAGE LEAF Vs COLOR OF THE LEAF
| Solution used | End color of the leaf |
|---|---|
| Lemon juice(strong acid)pH = 0 to 2 |  (reddish orange) (reddish orange) |
| Coke(weak acid)pH = 3 to 6 | 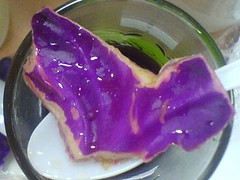 (pinkish scars) (pinkish scars) |
| Salty water(neutral)pH = 7 | 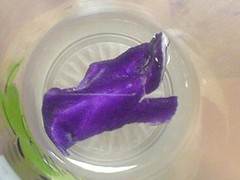 (no change in colour) (no change in colour) |
| Soapy water(weak base)pH = 8 to 12 | 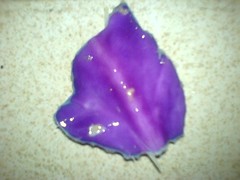 (darker pink) (darker pink) |
| Bleach(strong base)pH = 13 to 14 |  (greenish yellow) (greenish yellow) |
LESSONS LEARNT:
The following graph shows the color of red cabbage leaf corresponding to ph 2, 4, 7, 10 and 13.
Color of the leaf vs. pH
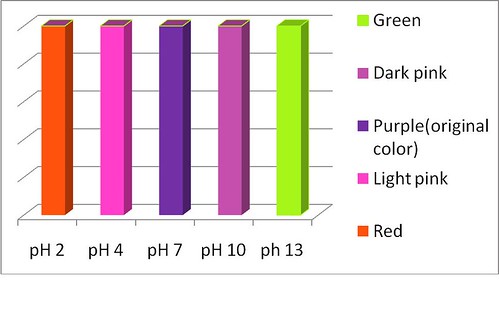
We see such a result because I changed the leaf sample every time before adding the solution. Moreover, a strong base (bleach of pH 13) and a strong acid (lemon juice of pH 2) were used to test the change in pH of the leaf. Thus as expected, the leaf showed a prominent color change (reddish orange in the case of the strong acid and greenish yellow in the case of the strong base). Moreover, the color of the leaf started changing from the sides of the leaf slowly progressing to the center. Each leaf sample was made to react for about 20 to 25 minutes.
page revision: 10, last edited: 08 Jan 2008 11:23


